Chrome DevTools now shows your own variable names in minified code
DevTools in Chrome 157 and 158 can show the names you wrote when you debug bundled code, run full Lighthouse reports from AI assistance, and adds new tools for coding agents.

On this page
Google has published its round-up of what changed in Chrome DevTools in November, covering Chrome 157 and Chrome 158. The post is dated 13 November 2026 and says everything in it "is now available in your browser" for anyone on Chrome Stable. Most of it is aimed at people who debug websites day to day. One change stands out: when you pause in code that has been bundled and minified, DevTools can now show the names you actually wrote.
Your own variable names in the debugger
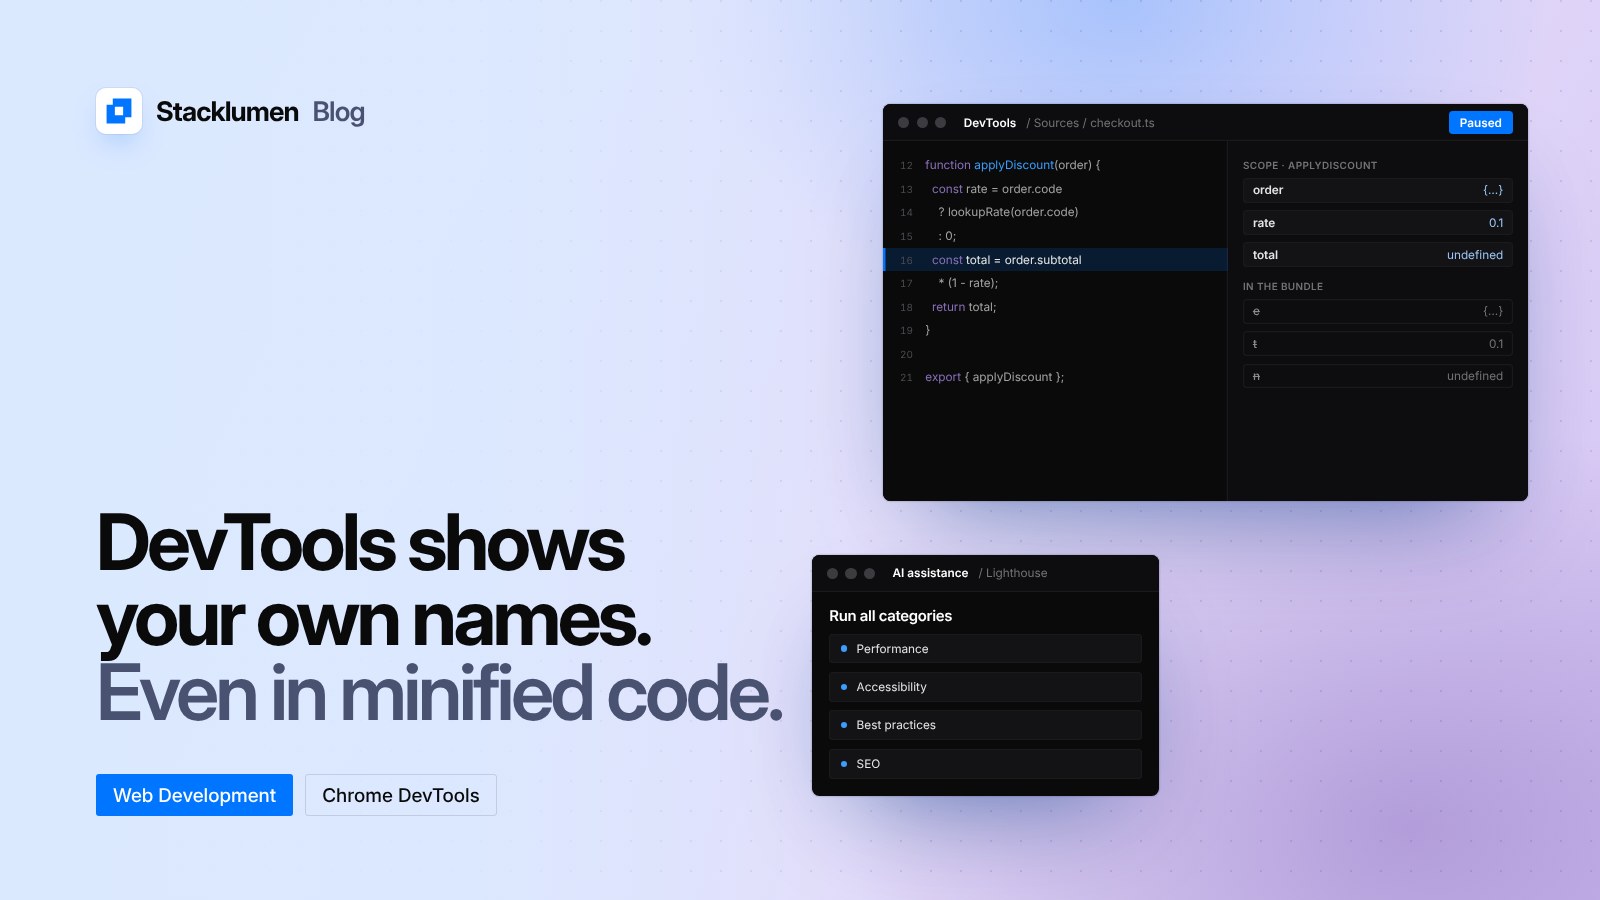
Build tools rename variables when they shrink your JavaScript, so total in your source can become n in the file the browser runs. Source maps already linked the two files line by line, but the debugger still showed the short names. DevTools now supports the ECMA-426 source map scopes proposal, which carries that missing information.
With source maps that include scopes, DevTools now:
- Rebuilds the original scope tree in the Scope pane while paused, showing your variable names and values instead of the minified ones.
- Shows original function names in stack traces, folds helper code the compiler split out back into the function it came from, and hides helpers the compiler added.
- Steps over and out of inlined and split-out functions as they appear in your source.
- Lets you use your original variable names in the Console, in Watch Expressions and in conditional breakpoints and logpoints, with autocomplete.
For this to work, your build tool has to write scope information into its source maps. The proposal is still a proposal, so check whether your bundler supports it before you expect to see the change.
Lighthouse inside AI assistance
You can now ask the AI assistance panel in DevTools to run a full Lighthouse report across all four categories: performance, accessibility, best practices and SEO. It can also run agentic-browsing audits on request. The assistant now gets a structured summary of failing audits and scores, which Google says helps it explain the findings more accurately. Reports for a single category show score gauges inline.
Elements panel
- You can force the
:bufferingand:stalledstates on<video>and<audio>elements from the :hov pane, so you can test loading and playback styles without slowing the network down. position-try-fallbacksdeclarations get a swatch that lets you force each fallback option on an anchored element. Theposition-areaeditor now also setsjustify-selfandalign-self.- The Styles tab now shows rules that use the
::highlight(*)selector. - The Styles tab now follows cascade layer (
@layer) and origin order when it decides which!importantdeclaration wins.
Application, Issues and Performance
- Clear site data now clears File System storage along with the other storage types.
- The Issues panel flags requests for location permission that are made without a user gesture, such as a click.
- Google says trace parsing in the Performance panel is roughly 26% faster on large traces and uses less memory at its peak.
- Clicking an
ariaNotifyannouncement in DevTools now jumps to the line of JavaScript that made it, and you can reveal the related element.
DevTools for coding agents
Releases 1.11.0 to 1.13.0 of the Chrome DevTools MCP server, which lets coding agents control and inspect Chrome, add several tools. Agents can set logpoints that log values without pausing the page, and set up virtual passkey authenticators to test sign-in flows that use passkeys or security keys. A lighthouse_audit run now returns failing audits and the affected elements inline. The server can also reload its configuration without a restart, analyse saved heap snapshots without a browser, and run independent tool calls in parallel.
What it means for your site
- If you debug a bundled site, check whether your build tool can write source map scopes. If it can, turn them on and try the Scope pane in an up-to-date Chrome.
- If you use cascade layers, look at
!importantrules again in the Styles tab, which now takes layer and origin order into account. - If your site asks for a visitor's location, open the Issues panel. A request made without a user gesture is now flagged.
- If you use a coding agent with the DevTools MCP server, update it to get logpoints, passkey testing and inline Lighthouse results.
- If your site plays video or audio, use the forced
:bufferingand:stalledstates to check what visitors see while media loads.