How to check a site's speed and search basics in Terminal
Site health in Terminal's designer runs PageSpeed Insights checks on published pages and checks every page's search basics. Here is how to run a check and read the results.

On this page
Terminal can check how fast a published page loads and whether every page covers the search basics, without leaving the designer. Here is how to use the Health section.
Open Site health
Open the site in the designer. At the right end of the bottom rail, open Developers (⌘J on a Mac, Ctrl+J elsewhere) and choose Health. It reads the site that is open.
Health has two parts. Speed checks one published page at a time. Search reports on every page from the site as it is saved, whether it is published or not.
Run a speed check
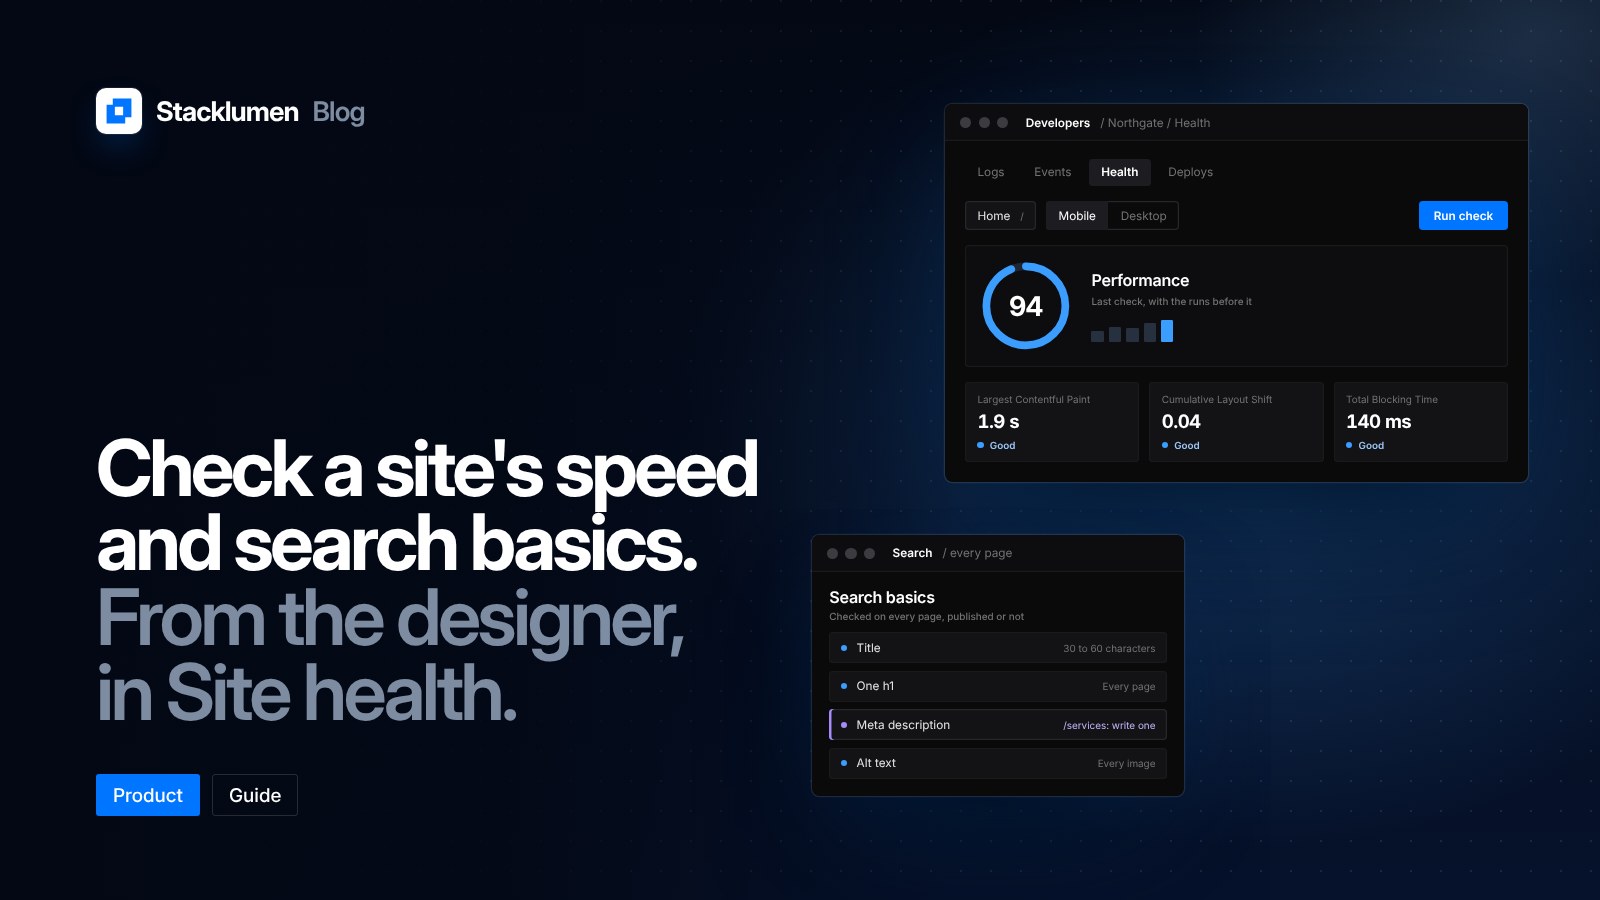
- Choose a page, starting with Home, and choose Mobile or Desktop. The section opens on the last result for that page and device, with the scores of earlier runs shown as a small trend.
- Press Run check. PageSpeed Insights loads the page at the site's own published address: your custom domain once it serves the site, otherwise the staging link. A check takes 10 to 40 seconds, and the section shows what it is doing and how long it has been running.
- Read the result: the performance score, the lab timings, real visitors' timings when there is enough traffic, and the changes that would make the page faster, each with its estimated saving.
A site that has never been published has nothing to check, and Health says so. A check always runs against one of the site's own pages; you cannot point it at another address.
Read the numbers
Each measure falls into Good, Needs work or Poor. The docs set the bands like this:
- Performance and search scores: 90 and up is good, under 50 is poor.
- Largest Contentful Paint: 2.5 seconds or less is good, over 4 seconds is poor.
- Interaction to Next Paint (real visitors): 200 ms or less is good, over 500 ms is poor.
- Cumulative Layout Shift: 0.1 or less is good, over 0.25 is poor.
- First Contentful Paint: 1.8 seconds or less is good, over 3 seconds is poor.
- Total Blocking Time: 200 ms or less on mobile (150 ms on desktop) is good; over 600 ms on mobile (350 ms on desktop) is poor.
- Speed Index: 3.4 seconds or less on mobile (1.3 seconds on desktop) is good; over 5.8 seconds on mobile (2.3 seconds on desktop) is poor.
Anything between the two is Needs work. If a page has too little traffic of its own, Health shows real visitors' timings for the whole site and says so. If the whole site has too little, it shows "Not enough real-user data yet."
Limits to know
- One check runs at a time for a page and device, and each can run once every 60 seconds. In between, Health shows the last result and when the next check can start.
- A workspace can run 200 checks a day.
- A check still going after 50 seconds stops and says so.
- Members who can edit the site run checks. Viewers and guests can read the results.
Read the search report
Search shows the search score from the last speed check, with each failing audit in plain words and how to fix it. It also checks that the published home page answers over https, and that robots.txt and sitemap.xml answer.
Then it runs Stacklumen's own checks on every page:
- Title: the title the page publishes with is 30 to 60 characters.
- Meta description: one is written, 70 to 160 characters, unless the page is hidden from search.
- h1: exactly one per page.
- Alt text: every image has it, or is marked as decoration.
- Share image: the page has one, or the site has a default.
- Canonical: the publisher writes one for every page; custom code that adds a second is flagged.
- Structured data: flagged only when a page has some that does not hold. A page without any is fine.
- Hidden from search: noted on every page that is hidden; on the home page it is a warning.
- Language: the page's own, or the site's from Settings, General.
Each finding names its page and says how to fix it. Page settings opens that page's settings, Show on the page selects the element, and Site settings opens the site's Settings.
One thing that can look like a fault: a staging link is never indexed by search engines, so the audit for a page blocked from indexing fails there by design. It passes once a domain serves the site.
The Native measure
Health also shows Native: how much of the site you edit in the designer's panels rather than as code. It gives the share of elements that are native and the share of the stylesheet held as native styles. Anything that is not the designer's own is listed under Not the designer's own on the rail, with Show, Delete and Convert.
Using an agent
An agent connected over MCP reads the same results with get_site_health and runs a check with run_speed_check, under the same limits as the designer.